
Managing social media channels is almost a science. It takes a very nuanced understanding of digital marketing efforts and a full analytics dashboard to create a strategy that delivers.
Understanding how your content performs on Twitter (now X) is key to growing your audience, improving engagement, and getting better results from your social media strategy.
Whether you’re a content creator, brand, or marketing leader, Twitter analytics data gives you the power to see what works, and more importantly what doesn’t, so you can make the right decisions.
In this guide, we’ll break down everything you need to know about how to see Twitter analytics, what the metrics mean, and how to use them to grow your account and hit your goals.
If you want to get more Twitter followers, you are in the right place. Let’s get started!
What are Twitter analytics?
Twitter analytics (or X analytics) is a built-in tool that shows you detailed post performance data about tweets and account activity. It helps you track other metrics too, like tweet impressions, engagement rate, follower growth, and more.
Tools like conversion tracking and click analytics dashboard are in-depth tools that say a lot about your Twitter activity.
Ultimately, Twitter analytics is an account overview that provides valuable insights into your Twitter presence.
With Twitter analytics, you can answer key questions such as:
- Which tweets perform best?
- When is my audience most active?
- Are my engagement rates improving?
- What kind of content drives traffic to my website?
- Am I getting new followers?
- How are my paid campaigns performing?
Whether you’re testing content ideas or running a Twitter campaign, Twitter analytics gives you the insights you need to measure success and adjust your strategy.
Think of it like a report card for your tweets that updates in real-time. The more frequently you access Twitter analytics, the better you can address growing brand awareness and boost how your account performs.
How to check Twitter analytics
Twitter makes it easy to access Twitter analytics, both basic and advanced, for your account: that’s the good news. Don’t be intimidated if you’ve never viewed the Twitter analytics dashboard or Tweet activity; better now than never!
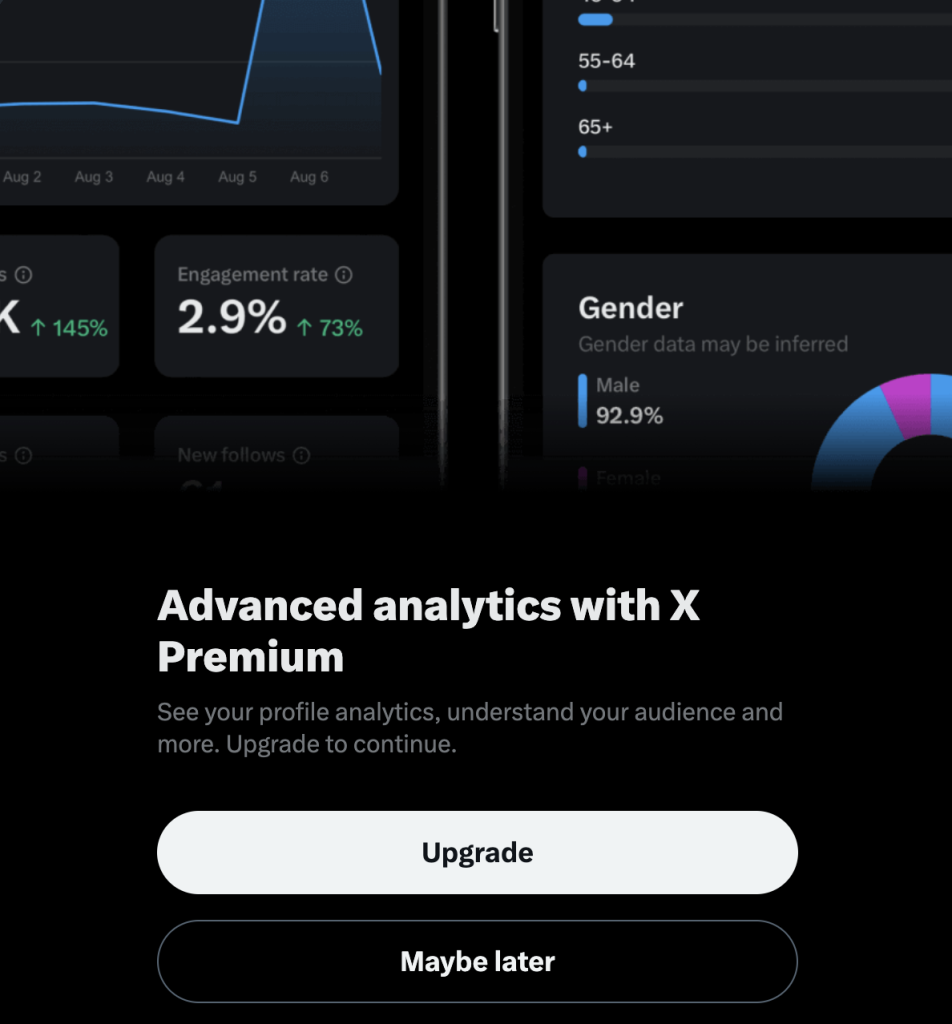
Note: In order to access Twitter analytics on the new X platform, you must be verified. If you are an individual, you can get verified by subscribing to the x premium account. It is worth being able to access analytics for the actionable insights, but it’s unfortunate that now it’s paid only.
Here’s how to dive in and view data.
How to see Twitter analytics from desktop
Be sure to subscribe to the premium account so that you can access twitter analytics.
- Log in to your account at twitter.com.
- Click on More in the left-hand menu.
- Select Creator Studio > Analytics.
- You’ll be taken to your analytics dashboard, where you can view your tweet performance, follower stats, profile visits, and more.
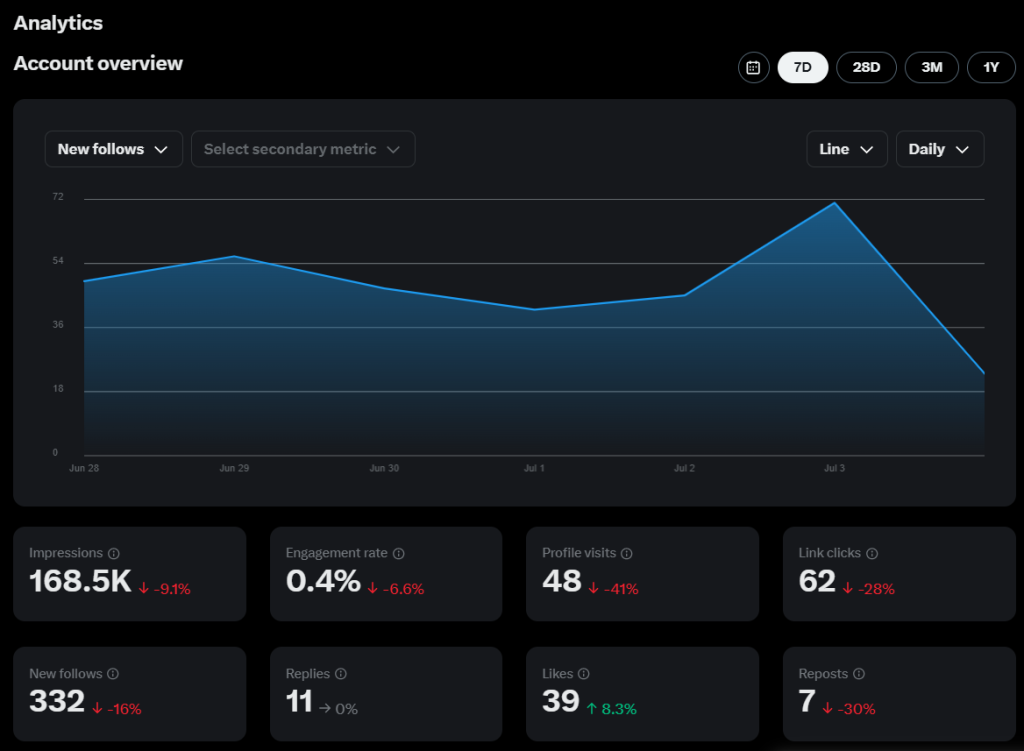
You can also go directly to analytics.twitter.com while logged in. From here, you can filter performance by time period, download reports, and explore tweet-level details.
How to view Twitter analytics from mobile
Twitter/X does not have a full-featured native analytics dashboard on the mobile app, but you can still view tweet-level data:
- Open the X app on your iPhone or Android.
- Navigate to a tweet you’ve posted.
- Tap the bar chart icon under the tweet.

This quick view shows you impressions, engagements, and engagement rate for that specific post. Any audience insights that you need, you can pretty much obtain directly from the Tweet activity.
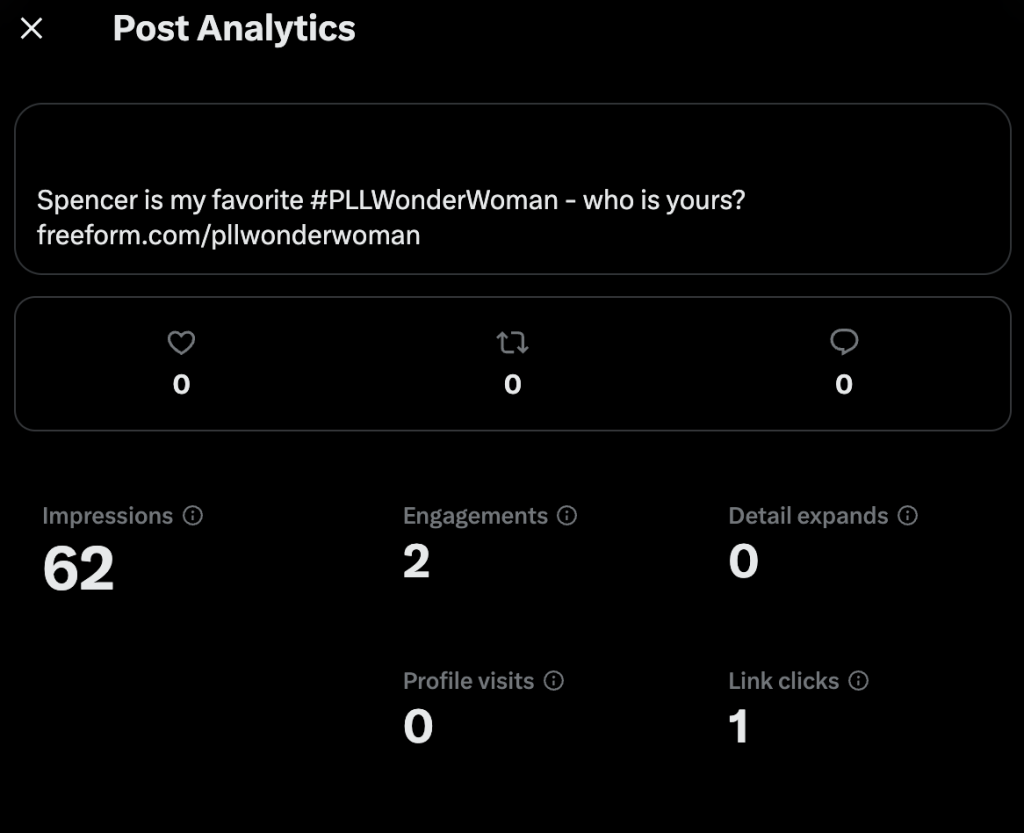
For example, if your tweet announcing a product launch received 10,000 impressions and 300 engagements, your engagement rate would be 3%. You can figure out and view the different metrics on each individual tweet.
If you’re on the go and want a full dashboard view, you can also access analytics.twitter.com from your mobile browser where you can see the regular account overview as you would on desktop.
Who are Twitter analytics for?
Anyone who posts on X with a goal in mind can benefit from Twitter analytics. That includes solo creators, social media managers, business owners, and marketing teams.
Social media is a powerful tool for monetization and expanding to new audiences, so there are plenty of creators and small business owners on the platform to maximize results and perform social listening at the same time.
In this section, we will explore two key players that Twitter analytics helps and how it can be used to expand a Twitter account for that user type.
Twitter analytics for practitioners
If you’re the one posting and managing the account, analytics help you:
- See engagement rate for top Tweets
- View analytics and decide on the best time and day to post
- Track follower growth and engagement rate over time
For example, if your tweet with a meme got 5x more engagement than your usual posts, that’s a clue your audience enjoys humor. You might experiment with more funny content or casual tone.
You can use this comprehensive view to see how your audience responds to certain content types and get more Twitter followers after refreshing your social media strategy.
Twitter analytics for marketing leaders
If you’re leading a team or managing multiple accounts for social media marketing, Twitter analytics help you:
- Measure ROI from Twitter/X campaigns
- Create performance reports for clients or leadership
- Make data-driven content and budget decisions
Let’s say you’re running a social media campaign to promote an event. Twitter analytics can show how many people clicked the event link, how many shared the post, and how many new followers you gained during the campaign.
You can check video activity and see how individual posts performed, perhaps compared to different platforms so you know what works best for Twitter marketing campaigns.
How Twitter analytics drives business results
Looking at the numbers isn’t just about vanity metrics or a simple account overview. Twitter analytics can drive real business value when used the right way, helping future content perform at the highest level possible.
How? Let’s look at some different factors that have an impact on analytics.
Holistic perspective of your target audience
By analyzing who engages with your tweets, you get a clearer picture of your audience’s interests, behaviors, and preferences. This helps you create content that resonates, builds community, and strengthens your brand.
Then, this detail expands into a viable content strategy that heightens social media performance on Twitter.
For example, if your analytics show that your audience engages more with tweets that include photos, you might incorporate more visual content into your strategy and individual posts.
Inform content strategy with performance data
When you know which tweet activity gets the most clicks, retweets, or replies, you can double down on what works. Twitter analytics removes the guesswork and gives you a blueprint for future posts.
Example: You notice tweets with tips or how-to content consistently perform well. That’s a sign to share more educational content. If you do that, you will likely have an influx of top tweets with new analytics to consider.
Measure impact of social media marketing campaigns
Running a product launch or promo on X? Twitter analytics shows you how many people saw your tweets, how they interacted, and what kind of traffic or conversions you generated.
Say you tweeted a discount code and got 200 link clicks and 50 redemptions. That’s a clear sign of campaign success and can help justify future budgets.
What metrics can you track with Twitter analytics?
Twitter analytics tracks a wide range of data points. Here’s a breakdown of key metrics you’ll see and what they mean.
Keep in mind that you can use the native Twitter analytics dashboard to check this stuff out, or you can consider a Twitter analytics tool such as Sprout Social, Hootsuite, or Metricool.
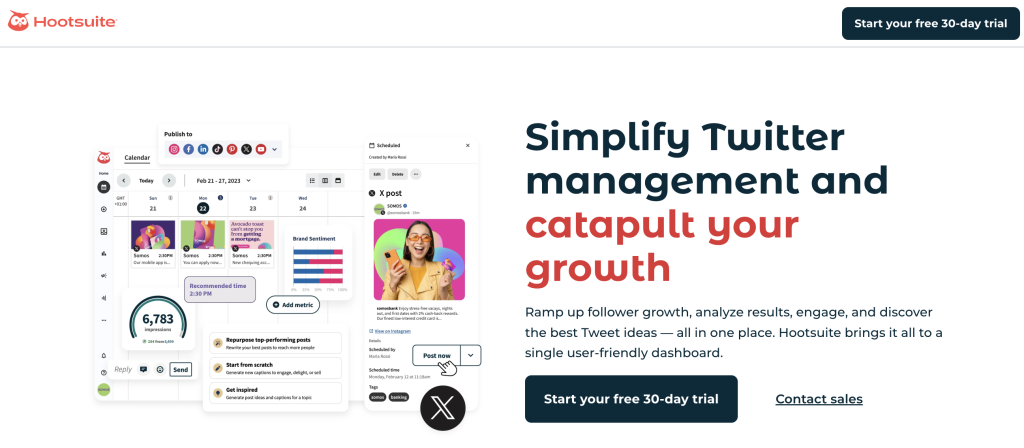
If you manage multiple social media accounts, using a Twitter analytics dashboard alongside other social media data can be useful.
Here are the metrics you can track for your Twitter account.
Impressions
The number of times your tweet was shown on someone’s screen. This includes appearances in timelines, search results, and profile visits. Tracking impressions helps you understand how far your content is spreading across the platform.
Reach
An estimate of the number of unique users who saw your tweet. While impressions count every view (including repeats), reach gives you a clearer picture of how many individual people your content actually reached. This metric does not include profile visits.
Engagement
The total number of interactions your tweet received. This includes likes, retweets, replies, link clicks, profile clicks, and media views. A high engagement number shows that your content sparked interest or action.
Engagement rate
The percentage of impressions that turned into engagements. Calculated as engagements divided by impressions, this metric reflects how compelling your content is. A higher engagement rate usually means your tweet resonated with your audience.
Link clicks
The number of times users clicked a link in your tweet. This is a key metric for driving traffic to your website, product page, or landing page. If you’re using UTM parameters, you can also track these clicks in Google Analytics.
Mentions
The number of times other users mentioned your Twitter handle in their tweets. This helps you gauge brand awareness, monitor customer conversations, and track PR or influencer efforts.
Followers
This shows your total number of followers. Tracking it over time can help you see how your audience grows or shrinks based on your content activity.
Response rate
This metric tells you how often you reply to mentions or messages. A high response rate shows good engagement and community management, which can lead to stronger brand loyalty.
Response time
How long it takes, on average, for you to respond to mentions or DMs. Fast response times can improve customer satisfaction, especially if you’re using X for customer support.
Profile visits
The number of people who clicked on your name and visited your Twitter profile. This often increases when a tweet performs well and people want to learn more about you or your brand.
Top posts
Your most successful tweets during a selected time frame. These are ranked by engagement or impressions. Analyzing your top posts helps you identify the formats, topics, or styles that work best.
Top mention
The highest-performing tweet by another user that mentioned your handle. This helps you discover advocates, influencers, or key moments when your brand got attention.
New followers
The number of followers you’ve gained in a certain period. You can track spikes during campaigns, events, or viral tweets to see what content drives audience growth.
Follower count
This is your current follower total. It’s a simple but important metric to track your long-term growth.
Reposts without comments
These are retweets where someone shared your tweet without adding their own comment. It’s a sign that others want to amplify your message without modifying it.
Likes
The number of users who tapped the heart icon on your tweet. Likes signal approval or agreement and are one of the most visible engagement types.
Replies
The number of direct responses your tweet received. High reply counts often indicate that your tweet sparked conversation or debate, which can increase visibility and engagement.
How to get deeper insights from your Twitter analytics

Twitter’s built-in analytics are a strong starting point, but there are additional ways to get even more value from select analytics.
Analyze patterns over time
Instead of focusing on single tweets, look for patterns over a week, month, or quarter. Are certain types of tweets (videos, questions, polls) consistently outperforming others? This long-term view helps you refine your content strategy.
You can also choose a specific date range, which can be very helpful if you run A/B testing or other campaigns.
Experiment and compare results
Test different content styles, hashtags, post times, or formats, then use analytics to compare performance. Try tweeting at 9 AM vs. 6 PM and see which time delivers more engagement. Check out the content tab and see how content compares.
Segment performance by campaign or goal
Group tweets by purpose, such as product launches, engagement campaigns, or brand awareness. Compare how each set performs to learn which types of initiatives yield the best results.
Track audience growth during events
If you’re live tweeting a conference or launching a new product, track how your follower count and impressions spike during the event. This helps you connect marketing actions to outcomes.
Save and report your data
Download analytics reports to share with clients, your team, or leadership. Regular reporting keeps everyone aligned and shows how your social strategy supports business goals.
Use Twitter analytics to back your strategy with data
Guessing is risky. When you base your Twitter strategy on data, you:
- Save time creating content that works
- Build stronger connections with your audience
- Track progress toward business goals
Analytics helps you understand why something worked—and how to do more of it. For example, if your behind-the-scenes content consistently gets replies and shares, you can confidently invest in similar posts.
X Twitter analytics FAQs
How can I see my Twitter analytics?
On desktop, go to analytics.twitter.com or click More > Creator Studio > Analytics in your account menu. On mobile, tap the bar chart icon on individual tweets.
Where have Twitter analytics gone?
Some users noticed that analytics are harder to find since Twitter rebranded to X. They’re still available, just under the Creator Studio section on desktop.
Where is Twitter analytics on iPhone?
There’s no full dashboard in the iOS app. However, you can see tweet-level insights by tapping the bar chart icon below each of your posts. You’ll have to check them out on each individual piece of Twitter content.
Can I see Twitter analytics without a premium account?
Unfortunately, now you do need to subscribe to a premium Twitter account (X).
Final thoughts
If you’re serious about growing your presence on X (formerly Twitter), tracking your analytics is a must. Whether you’re posting daily as a content creator or managing multiple campaigns for a business, the right data helps you get better results on the social network.
Hopefully you have a clear idea on how to see Twitter analytics and what they mean for your Twitter account.
Use Twitter’s built-in tools to get started. The more you know about your audience and what they like, the easier it becomes to create content that performs and converts. You can then switch to a more in-depth third party tool if you think that would be valuable.
Start exploring your analytics today, and turn your tweets into tools for growth.